EPLF® publishes annual statistics on the total sales for the previous year. The data reported by Ordinary members (producers) is collected on a quarterly basis and summed up at the end of the year. The Association makes public only the information below, as all other data is confidential and reserved for members.
EPLF® publishes annual statistics on the total sales of its members for the previous year. The data reported by ordinary members (producers) is collected on a quarterly basis and summed up at the end of the year. These figures relate solely to their European production. The association makes public only the information below, as all other data is confidential and reserved for members.
2007 – 2025 EPLF MEMBERS SALES (IN MIO M²)
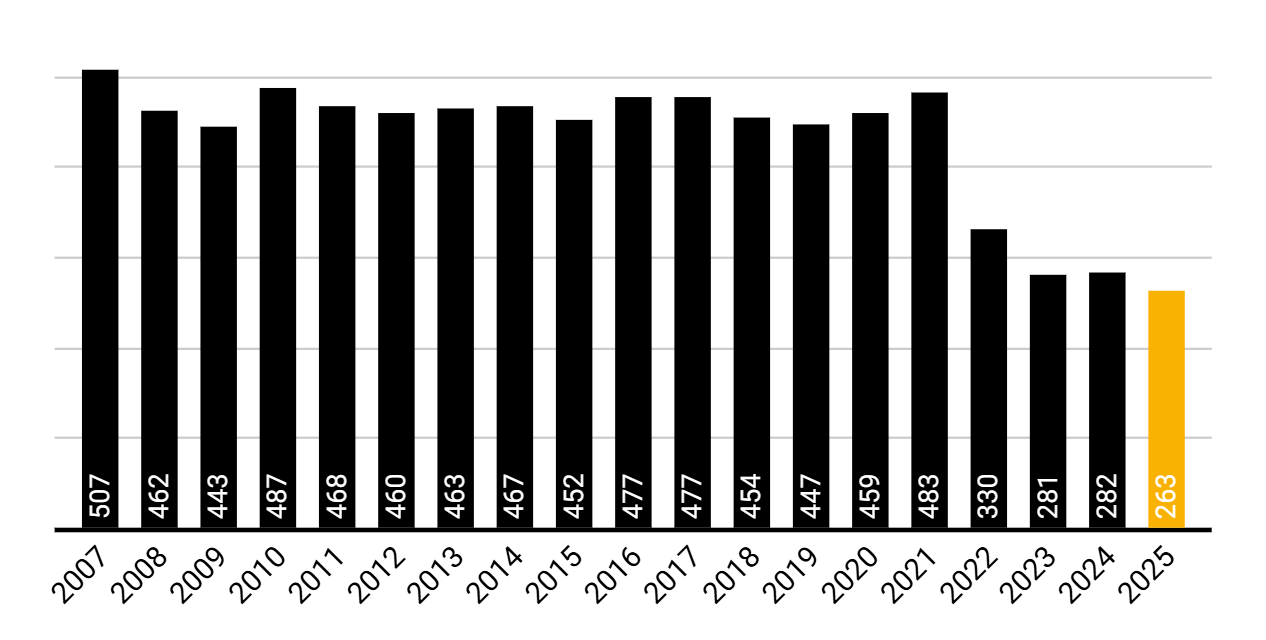
The EPLF total sales for 2025 amount to 263,375,503 m² (-6.5% compared to 2024). The decline reflects the continued slowdown in construction activity and consumer spending, yet laminate flooring remains a competitive and resilient choice due to its durability, affordability, and strong value for money proposition.
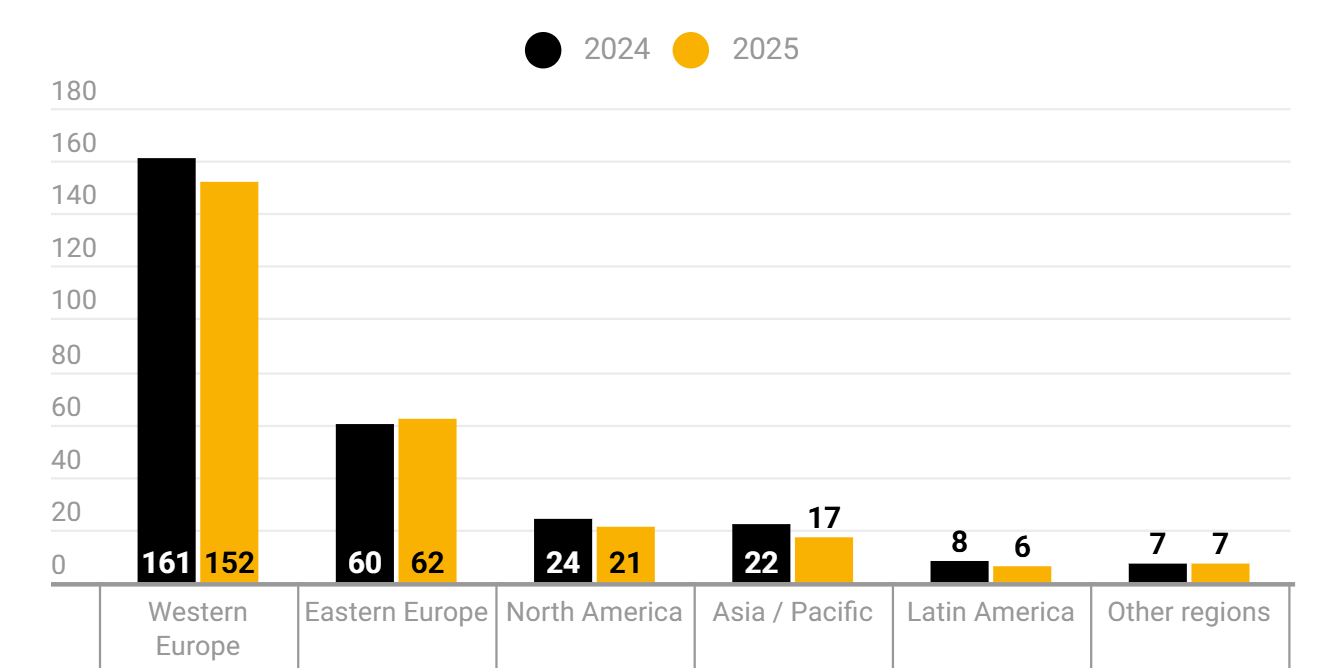
2025 EPLF MEMBERS WORLDWIDE SALES (IN MIO M²)
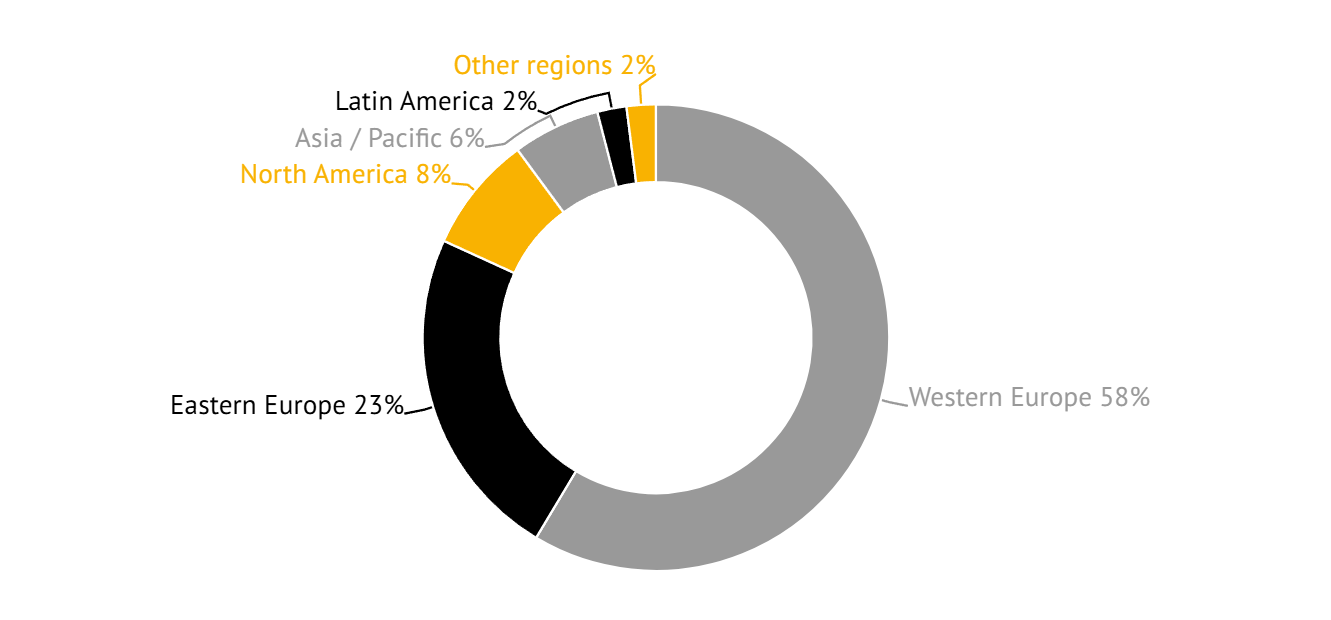
- 2025 sales in Western Europe: 151,806,094 m² (-5.6% compared to 2024)
- 2025 sales in Eastern Europe: 61,561,599 m² (+2.6% compared to 2024)
- 2025 sales in North America: 20,604,220 m² (-12.4% compared to 2024)
- 2025 sales in Asia: 14,845,483 m² (-24,5% compared to 2024)
- 2025 sales in Latin America: 6,376,655 m² (-20.6% compared to 2024)
- 2025 sales in Africa: 2,597,011 m² (-31.5% compared to 2024)
- 2025 sales in Australia/Oceania: 1,664,649 m² (-17% compared to 2024)
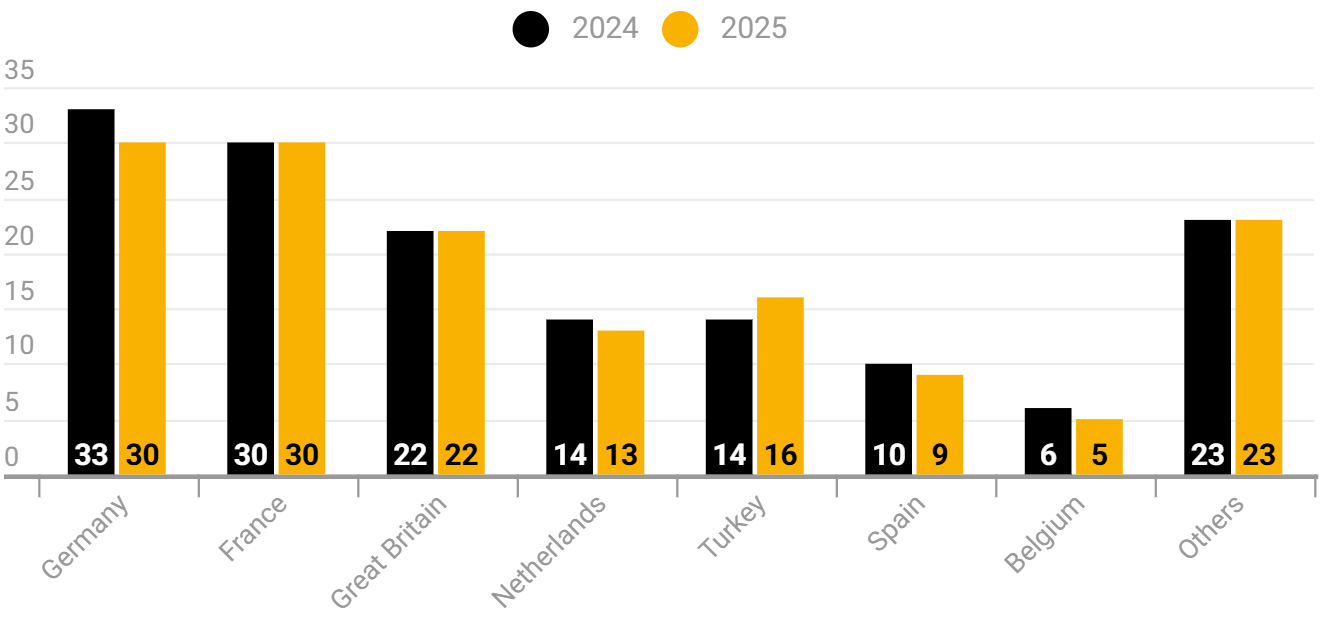
2025 EPLF MEMBERS SALES IN WESTERN EUROPE (IN MIO M²)
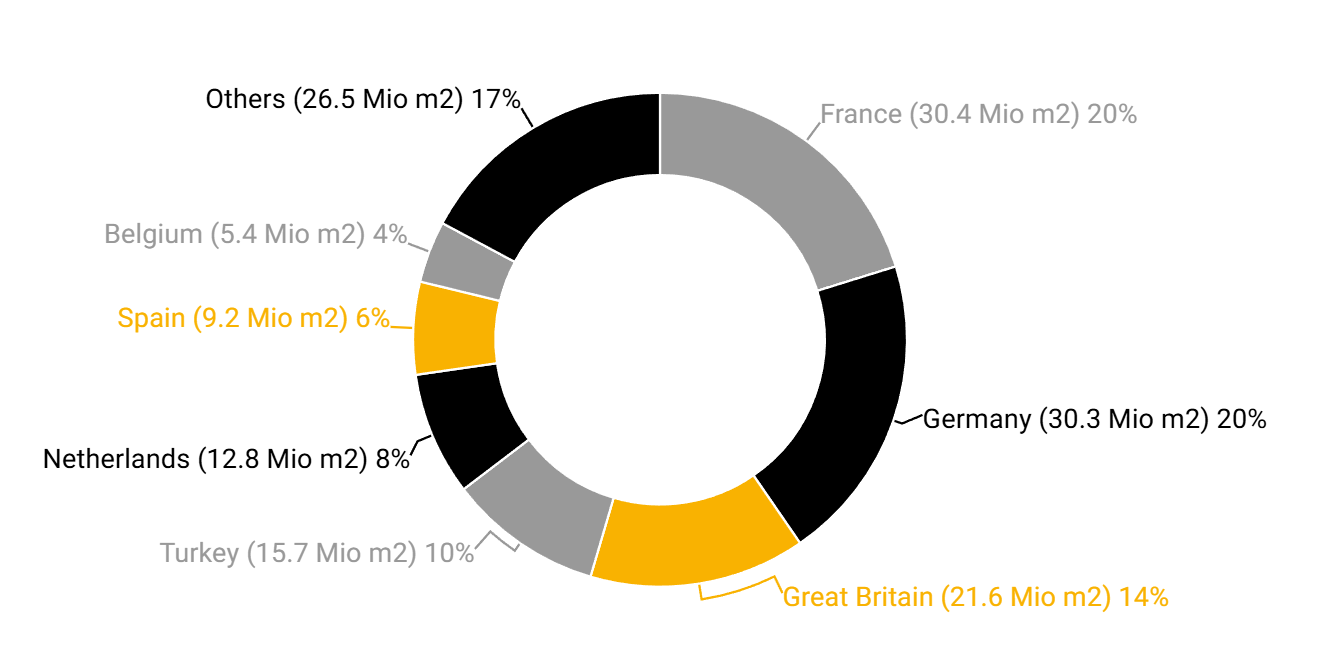
Total sales: 151,806,094 m² (-5.62% compared to 2024)
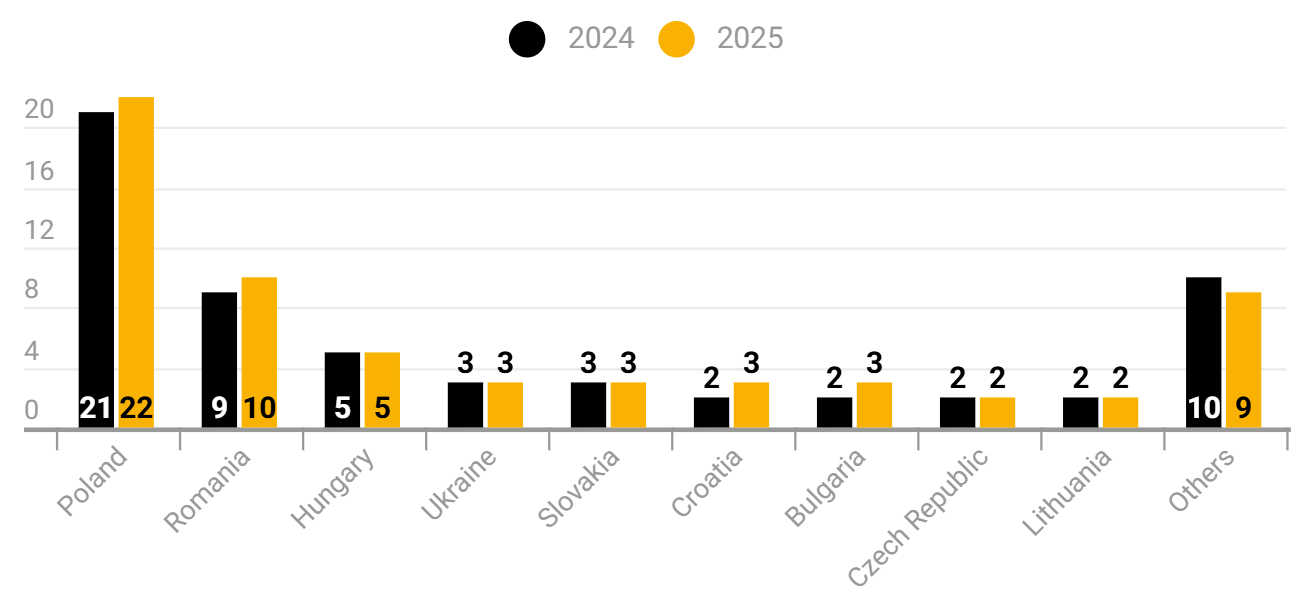
2025 EPLF MEMBERS SALES IN EASTERN EUROPE (IN MIO M²)
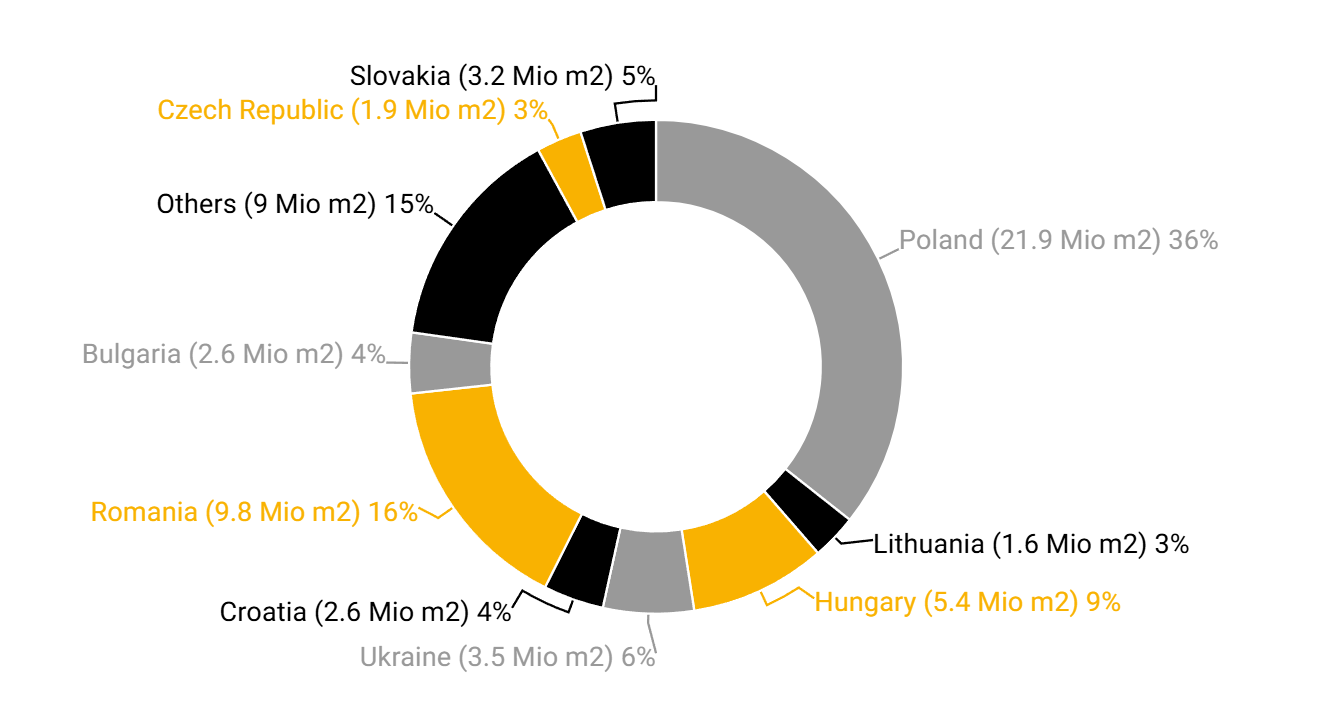
Total sales: 79,060,550 m² (-13,97% compared to 2024)
2025 EPLF MEMBERS SALES (IN MIO M²)
North America (20.6 Mio m²): -12.4% vs 2024
- USA (16.4 Mio m²): -8.6%
- Canada (4.2 Mio m²): -24.5%
Asia (14.8 Mio m²): -24.5% vs 2024
- Kazakhstan (2.6 Mio m²): -36.9%
- Taiwan (2.3 Mio m²): -26.1%
- Kyrgyzstan (1.4 Mio m²): +10.6%
Latin America (6.4 Mio m²): -20.6% vs 2024
- Chile (3.4 Mio m²): -11.6%
- Mexico (1.2 Mio m²): -41.4%
Africa (2.6 Mio m²): -31.5% vs 2024
- Egypt (0.9 Mio m²): -31.3%
- Morocco (0.9 Mio m²): -2.7%
Oceania (1.7 Mio m²): -17% vs 2024
- Australia (1.2 Mio m²): -20.8%